VegaProf: Profiling Vega Visualizations


Published at
UIST
| Bay Area
2023
Abstract
Domain-specific languages (DSLs) for visualization aim to facilitate
visualization creation by providing abstractions that offload implementation and
execution details from users to the system layer. Therefore, DSLs often execute
user-defined specifications by transforming them into intermediate
representations (IRs) in successive lowering operations. However, DSL-specified
visualizations can be difficult to profile and, hence, optimize due to the
layered abstractions. To better understand visualization profiling workflows and
challenges, we conduct formative interviews with visualization engineers who use
Vega in production. Vega is a popular visualization DSL that transforms
specifications into dataflow graphs, which are then executed to render
visualization primitives. Our formative interviews reveal that current developer
tools are ill-suited for visualization profiling since they are disconnected
from the semantics of Vega's specification and its IRs at runtime. To address
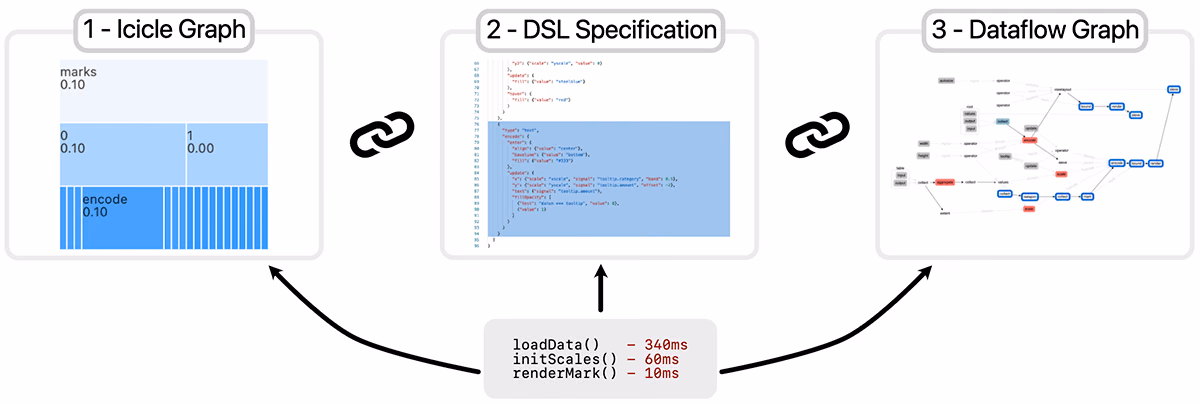
this gap, we introduce VegaProf, the first performance profiler for Vega
visualizations. VegaProf instruments the Vega library by associating a
declarative specification with its compilation and execution. Integrated into a
Vega code playground, VegaProf coordinates visual performance inspection at
three abstraction levels: function, dataflow graph, and visualization
specification. We evaluate VegaProf through use cases and feedback from
visualization engineers as well as original developers of the Vega library. Our
results suggest that VegaProf makes visualization profiling more tractable and
actionable by enabling users to interactively probe time performance across
layered abstractions of Vega. Furthermore, we distill recommendations from our
findings and advocate for co-designing visualization DSLs together with their
introspection tools.