Average Estimates in Line Graphs are Biased Toward Areas of Higher Variability


Published at
VIS
| Melbourne
2023
- Best Paper Honorable Mention
Abstract
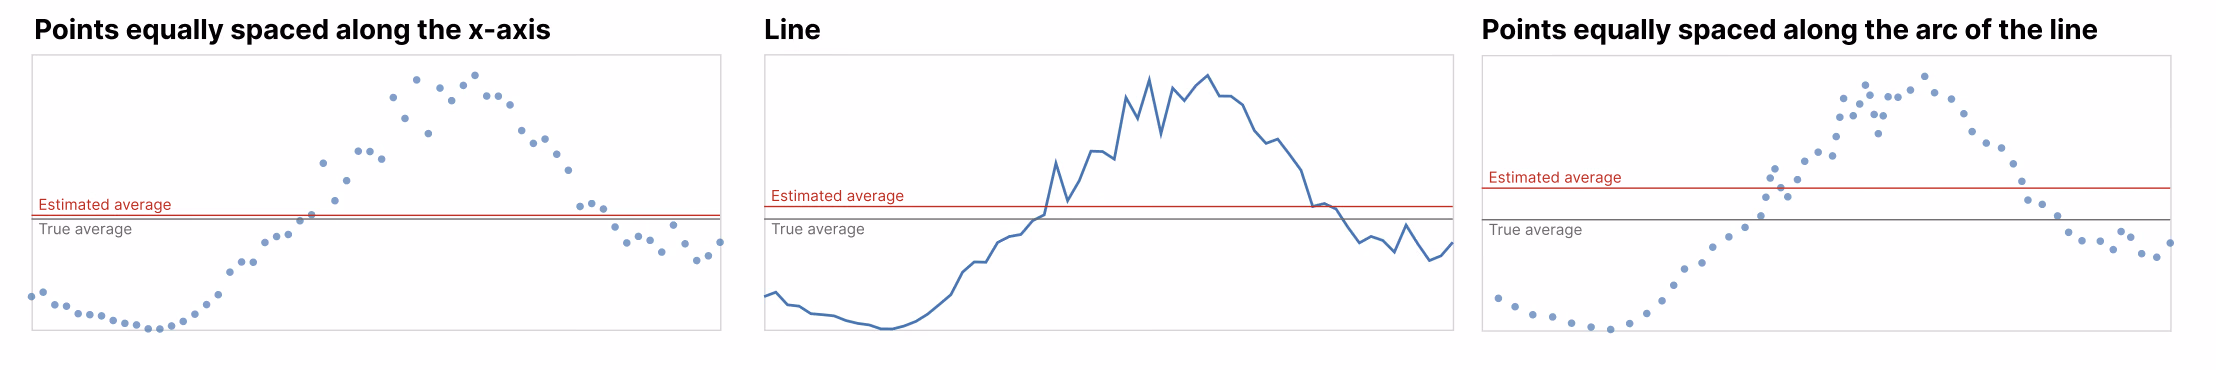
We investigate variability overweighting, a previously undocumented bias in line
graphs, where estimates of average value are biased toward areas of higher
variability in that line. We found this effect across two preregistered
experiments with 140 and 420 participants. These experiments also show that the
bias is reduced when using a dot encoding of the same series. We can model the
bias with the average of the data series and the average of the points drawn
along the line. This bias might arise because higher variability leads to
stronger weighting in the average calculation, either due to the longer line
segments (even though those segments contain the same number of data values) or
line segments with higher variability being otherwise more visually salient.
Understanding and predicting this bias is important for visualization design
guidelines, recommendation systems, and tool builders, as the bias can adversely
affect estimates of averages and trends.