Combining Degree of Interest Functions and Progressive Visualization
Published at
VIS
| Melbourne
2023

Abstract
When visualizing large datasets, an important goal is to emphasize data that is
relevant to the task at hand. A common way of achieving this is to compute the
relevance of the data using degree of interest (DOI) functions, which apply a
scenario-specific metric to quantify the data items according to their relevance
to the users and their tasks. These DOI values can then be used to adjust the
visual encoding through mechanisms like focus+context or information hiding. For
datasets too large to be visualized at once, an alternative approach is to
visualize it progressively in chunks, allowing analysts to reason about partial
results and concluding their analysis much earlier than had they waited for all
data. Combining the advantages of both approaches to tailor the visualization
seems synergistic, yet, in practice turns out to be challenging, as DOI
functions require the context of all data to produce useful values, requiring
lengthy computations that break analysts' flow in progressive visualization. In
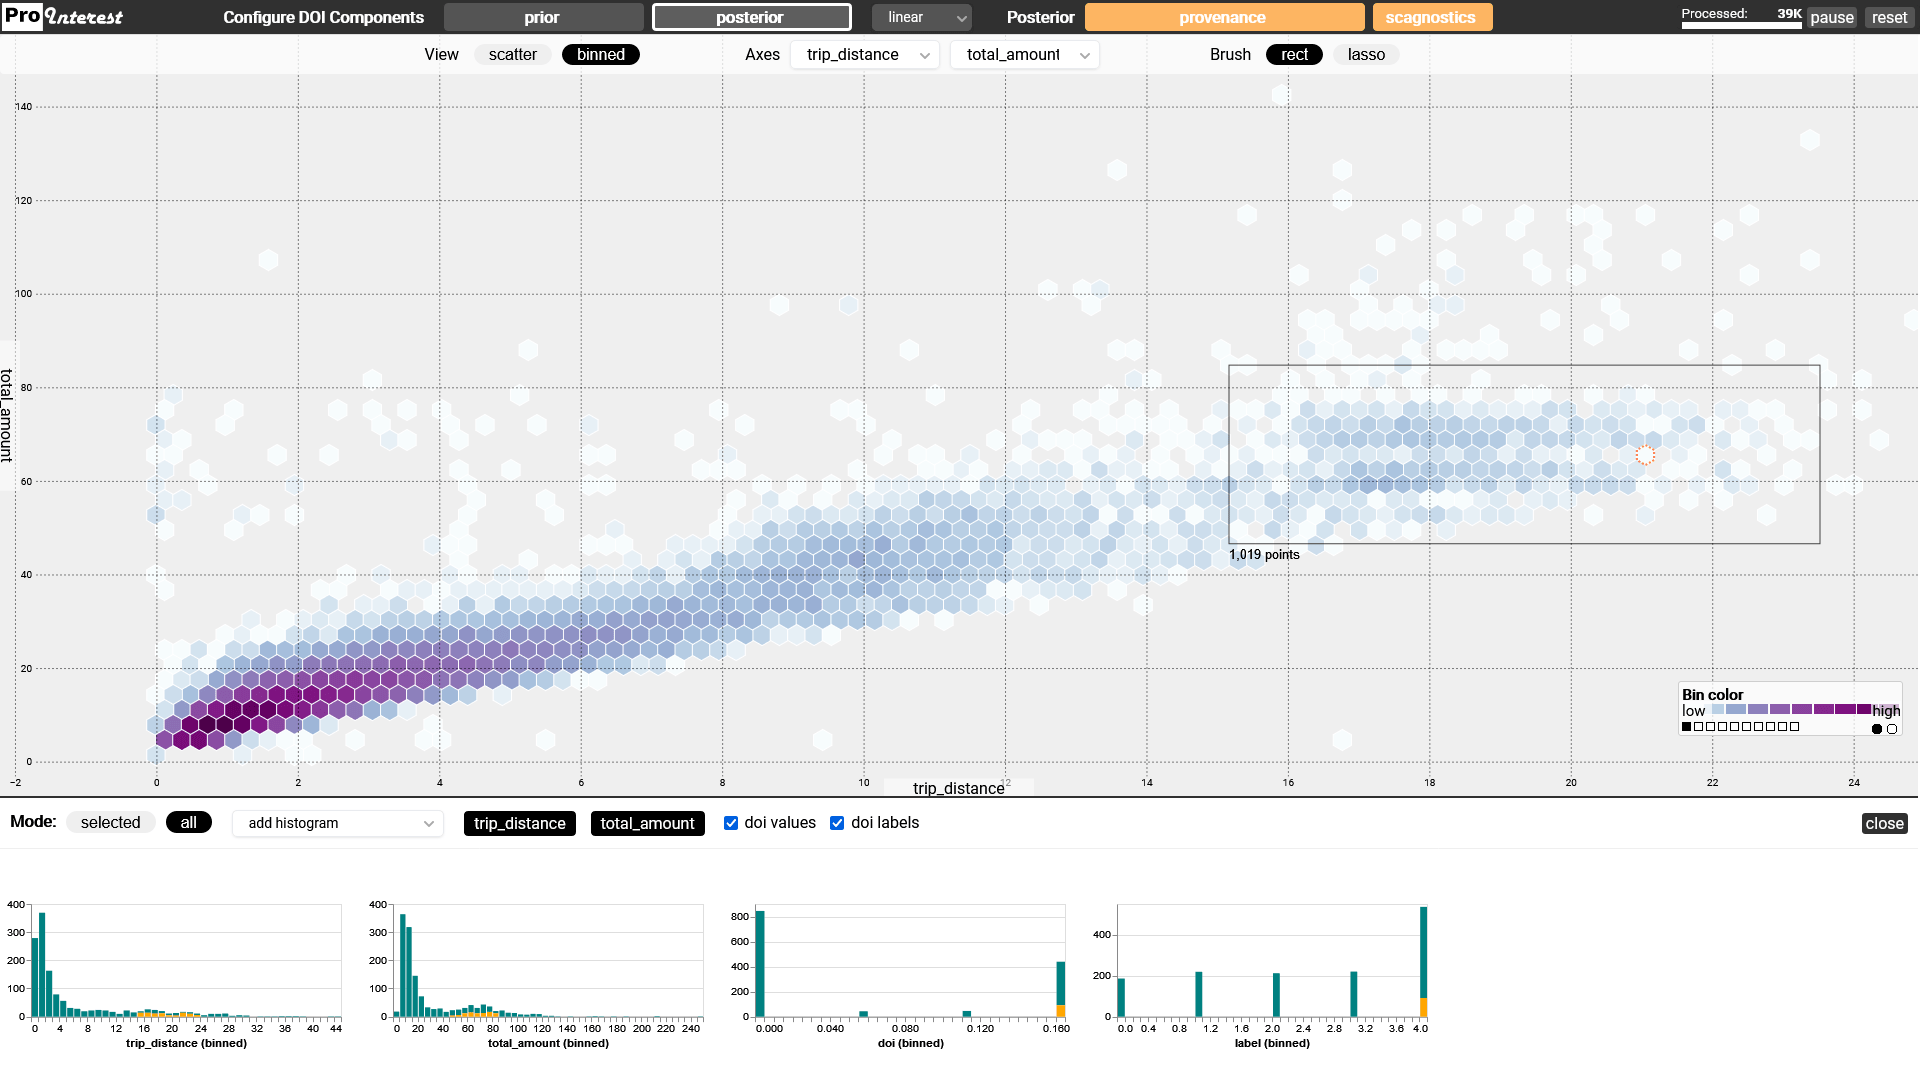
this paper, we propose an approach for uniting DOI functions with progressive
visualization. We first introduce a new model for quantifying the user interest
in analysis scenarios where the data is only partially available, by computing
the interest for available data and predicting it for the rest. We then propose
regression trees for implementing this approach in practice and evaluate it in
benchmarks. With DOI values now available for progressive visualization as well,
our approach opens the door for tailoring the visualization of large datasets to
the analysis task at interactive update rates