Trust, but Verify: Optimistic Visualizations of Approximate Queries for Exploring Big Data


Published at
CHI
| Denver, CO, USA
2017
Optimistic Visualization gives data analysts confidence to use approximation for EDA.
Abstract
Analysts need interactive speed for exploratory analysis, but big data systems
are often slow. With sampling, data systems can produce approximate answers fast
enough for exploratory visualization, at the cost of accuracy and trust. We
propose optimistic visualization, which approaches these issues from a user
experience perspective. This method lets analysts explore approximate results
interactively, and provides a way to detect and recover from errors later.
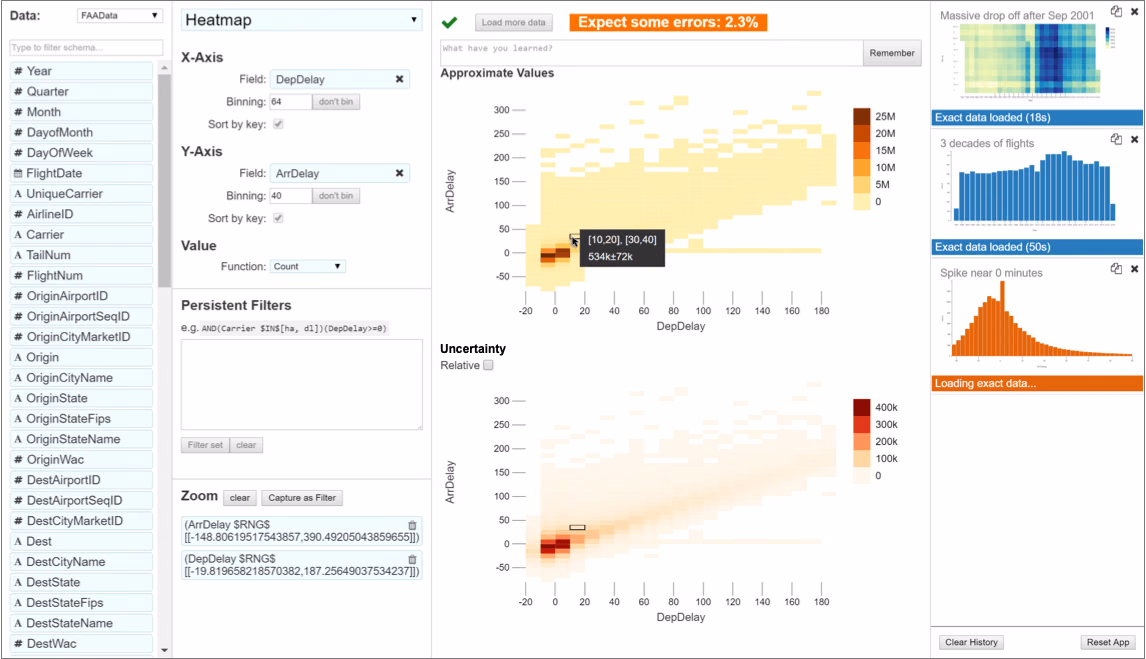
Pangloss implements these ideas. We discuss design issues raised by optimistic
visualization systems. We test this concept with five expert visualizers in a
laboratory study and three case studies at Microsoft. Analysts reported that
they felt more confident in their results, and used optimistic visualization to
check that their preliminary results were correct.