Progressive Visual Analytics: User-Driven Visual Exploration of In-Progress Analytics


Published at
VAST
| Paris, France
2014
Abstract
As datasets grow and analytic algorithms become more complex, the typical
workflow of analysts launching an analytic, waiting for it to complete,
inspecting the results, and then re-launching the computation with adjusted
parameters is not realistic for many real-world tasks. This paper presents an
alternative workflow, progressive visual analytics, which enables an analyst to
inspect partial results of an algorithm as they become available and interact
with the algorithm to prioritize subspaces of interest. Progressive visual
analytics depends on adapting analytical algorithms to produce meaningful
partial results and enable analyst intervention without sacrificing
computational speed. The paradigm also depends on adapting information
visualization techniques to incorporate the constantly refining results without
overwhelming analysts and provide interactions to support an analyst directing
the analytic. The contributions of this paper include: a description of the
progressive visual analytics paradigm; design goals for both the algorithms and
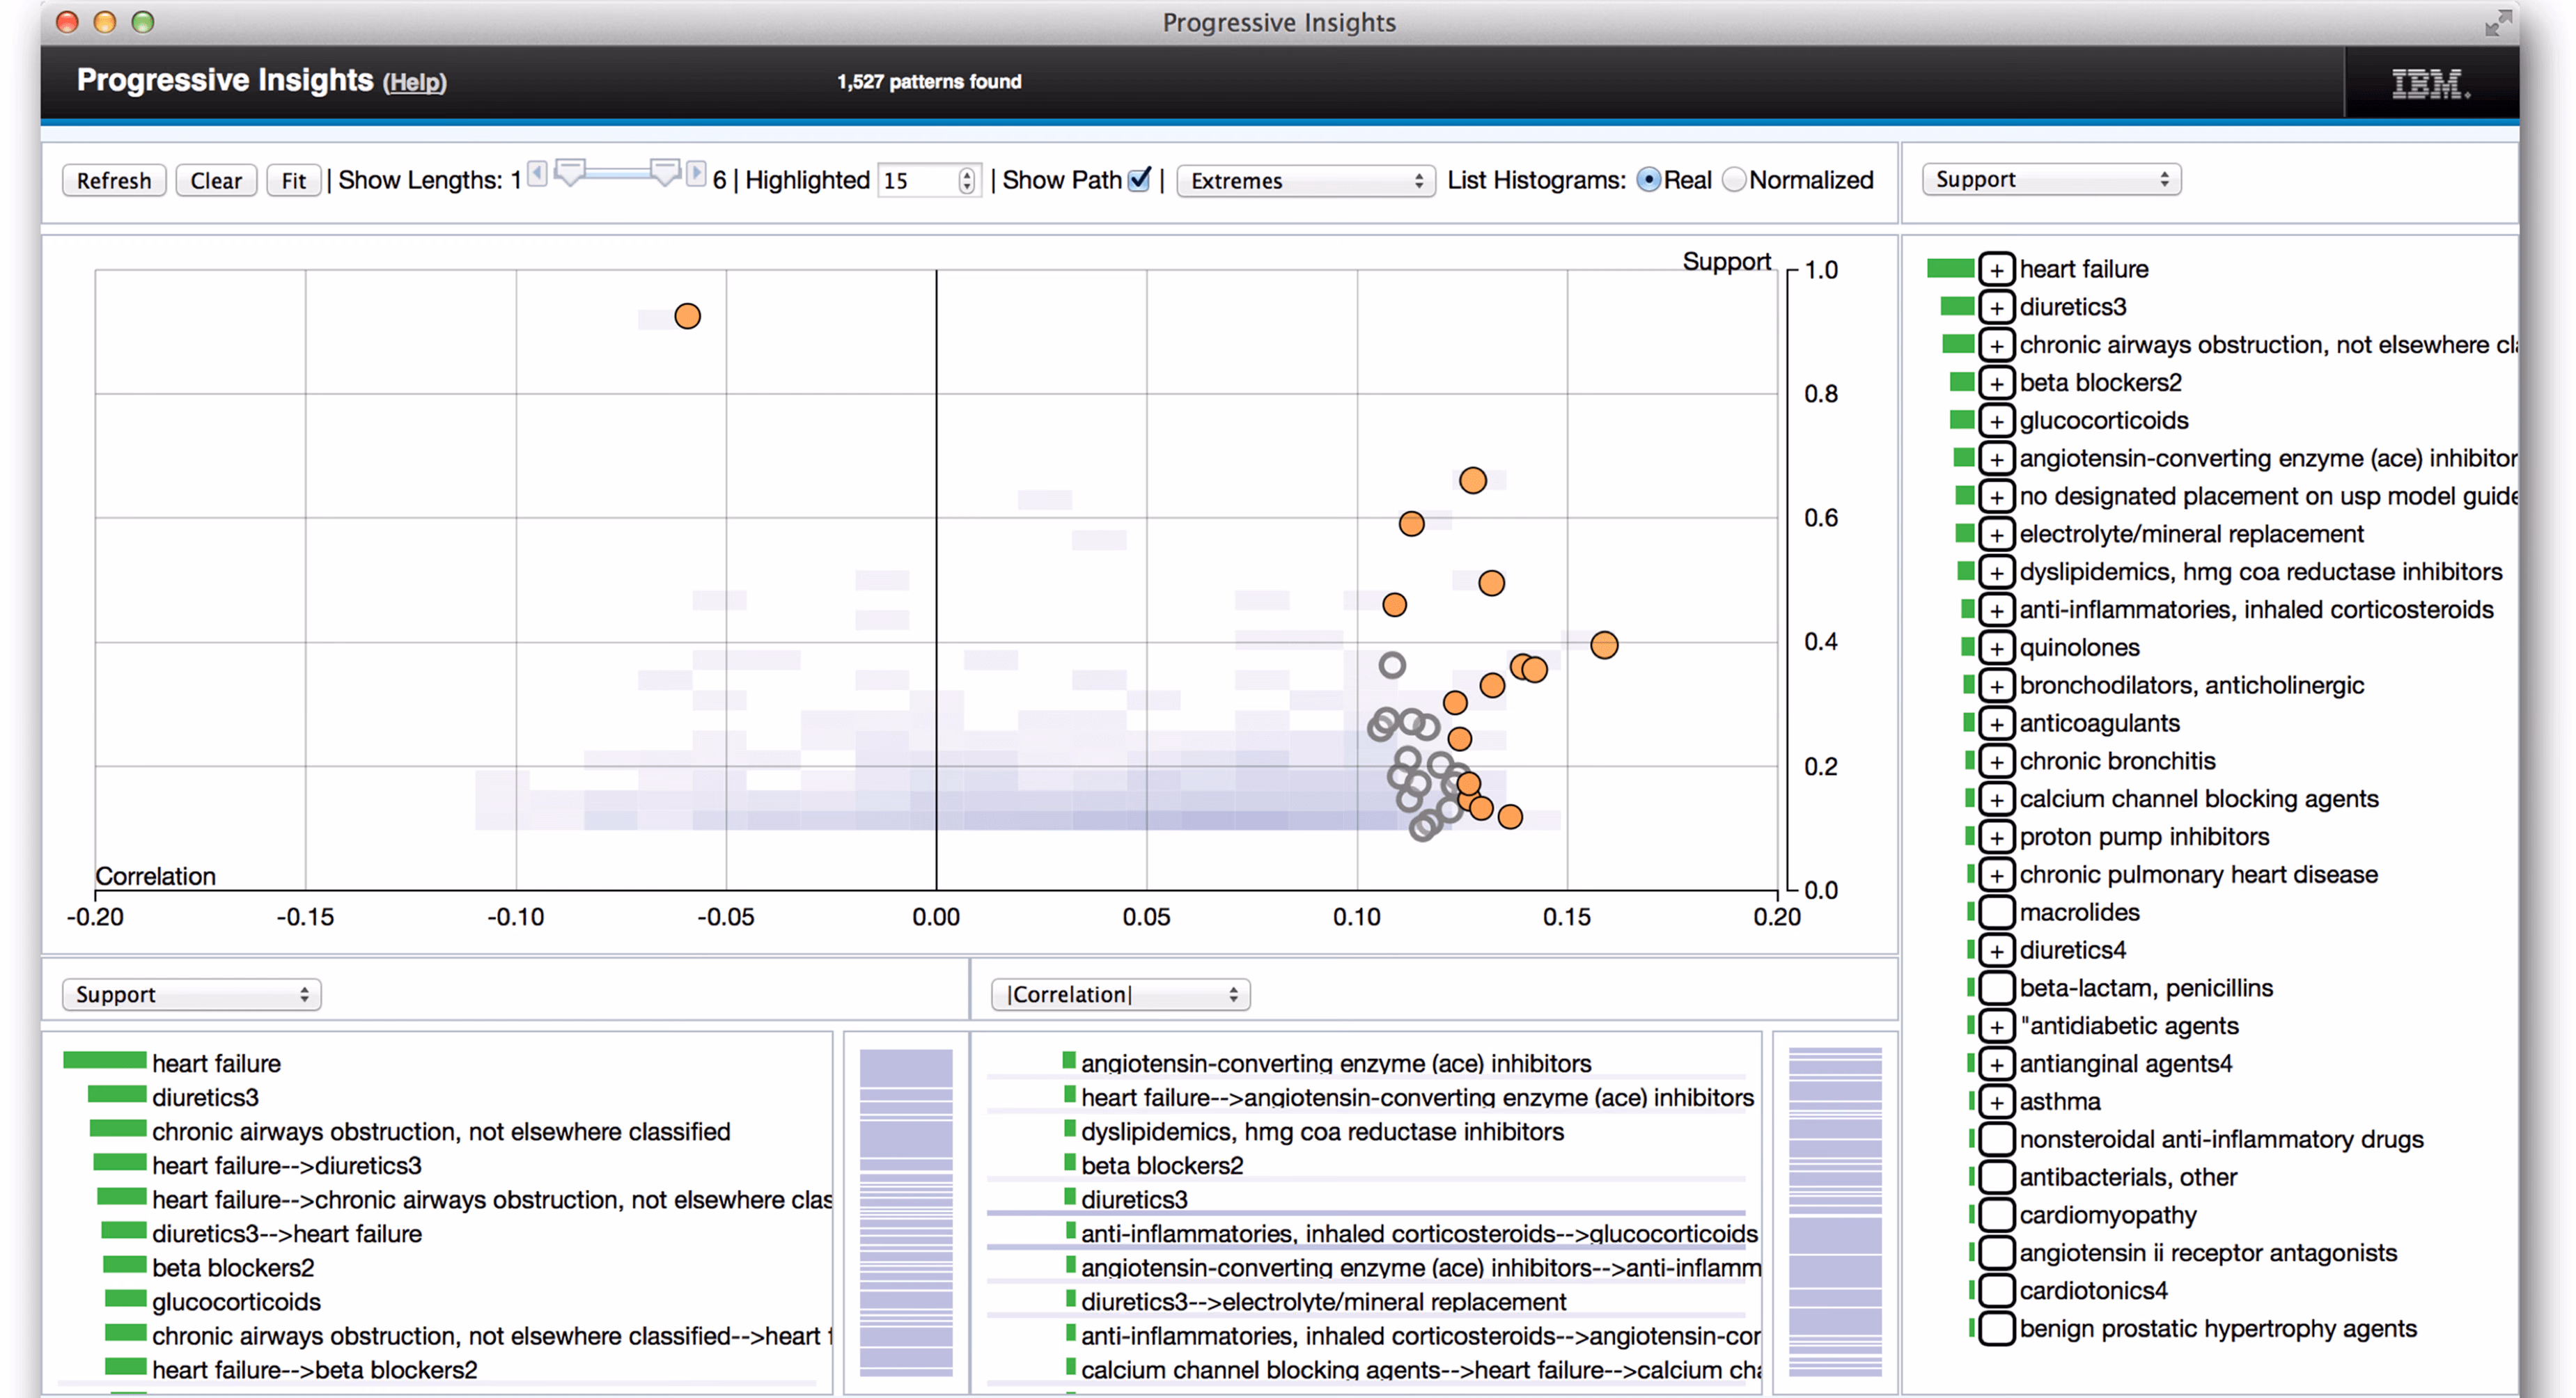
visualizations in progressive visual analytics systems; an example progressive
visual analytics system (Progressive Insights) for analyzing common patterns in
a collection of event sequences; and an evaluation of Progressive Insights and
the progressive visual analytics paradigm by clinical researchers analyzing
electronic medical records.