Cross-Filtering at Scale
FalconVis enables you to explore millions (or even billions) of data entries with no interaction delay.
With a large amount of data, cross-filtering is painfully slow. When you filter one visualization, the other visualizations take a while to update. The filtering lag disrupts the whole cross-filtering experience!
FalconVis removes the latency from where it matters (the cross-filtering user interaction) and puts it where latency doesn't matter (before interaction).
FalconVis computes the Falcon data index right before you interact with a view. As you filter the view, we use the index to instantly compute the counts for all other views. The result is smooth interaction at any scale.
FalconVis also supports data formats that scale: in-browser formats (JSON, Apache Arrow, and DuckDB WASM) and backend formats (HeavyAI or HTTP requests to any backend SQL server you want).
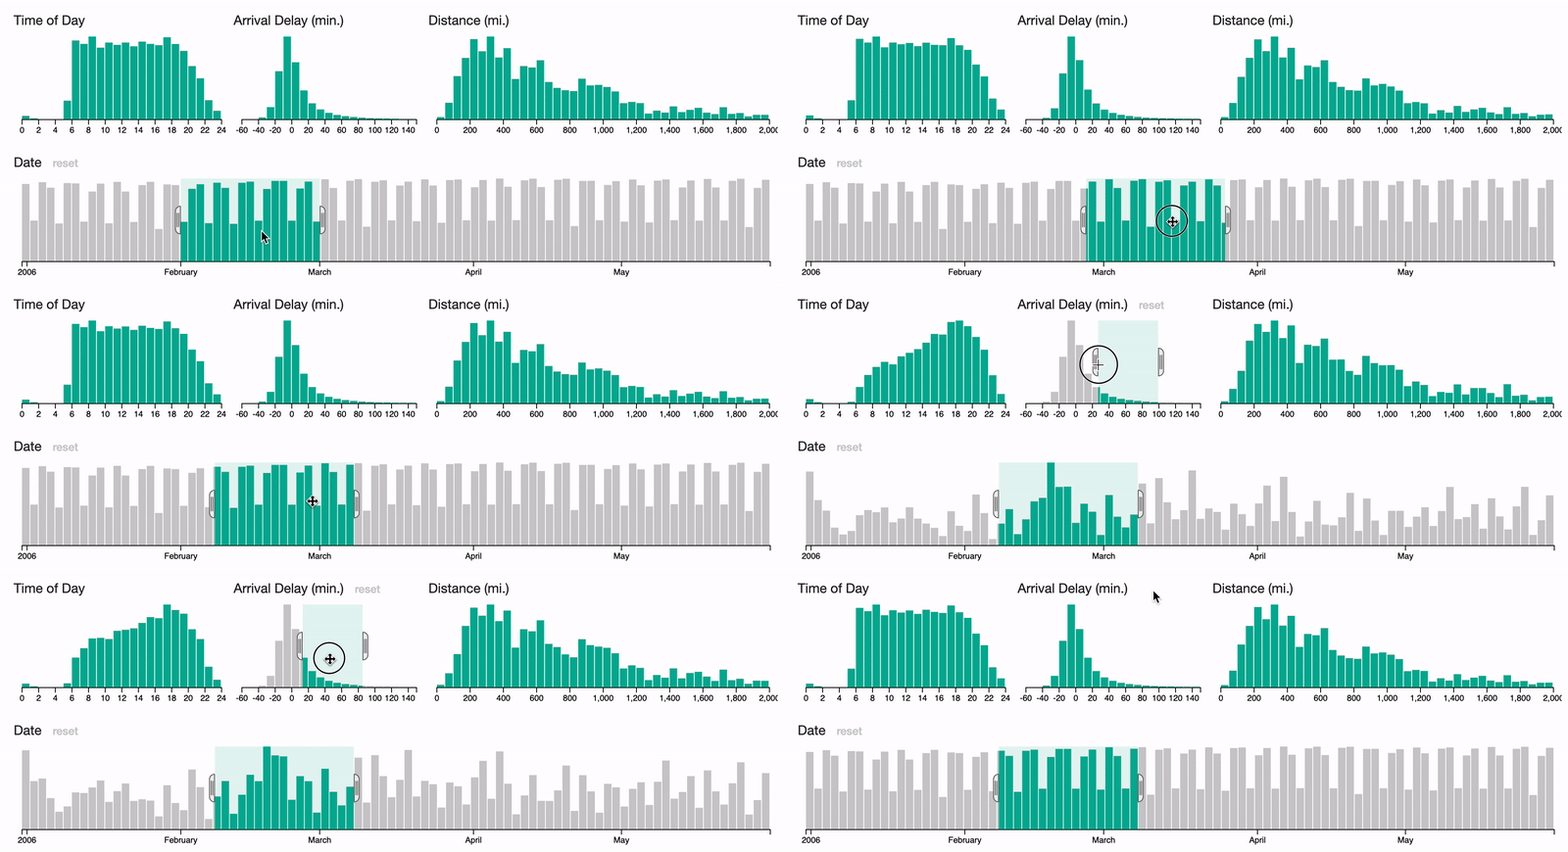
Live Example: Airline on-time performance
This live demo was forked from the CrossFilter Javascript Library's live demo to compare performance with an existing library.
We take the same D3 visualizations from their live demo, but using FalconVis instead with more than 10x the data (from ~260,000 to 3,000,000). We use a parquet file loaded into the DuckDB WASM in-browser database in this example.
Try out the live demo below!
Some questions to consider: How does time-of-day correlate with arrival delay? Are longer or shorter flights more likely to arrive early? How do flight patterns differ between mornings and nights?
Click for help
