🏗️
Rich Navigable Structures
Build list, tree, spatial, or graph-based navigation structures that make sense for your data.
A JavaScript library that enables keyboard, screen reader, and multi-modal navigation of data structures and visualizations.
Data Navigator enables designers and developers to render a semantic, navigable structure on top of any graphic. This structure can be used by a massive variety of different input modalities.
Quick links:
An overview of what Data Navigator does, why we made it, and what we hope our system is used for:
Modern data visualization accessibility faces 3 challenges in design and development that we wanted to help practitioners and researchers tackle:
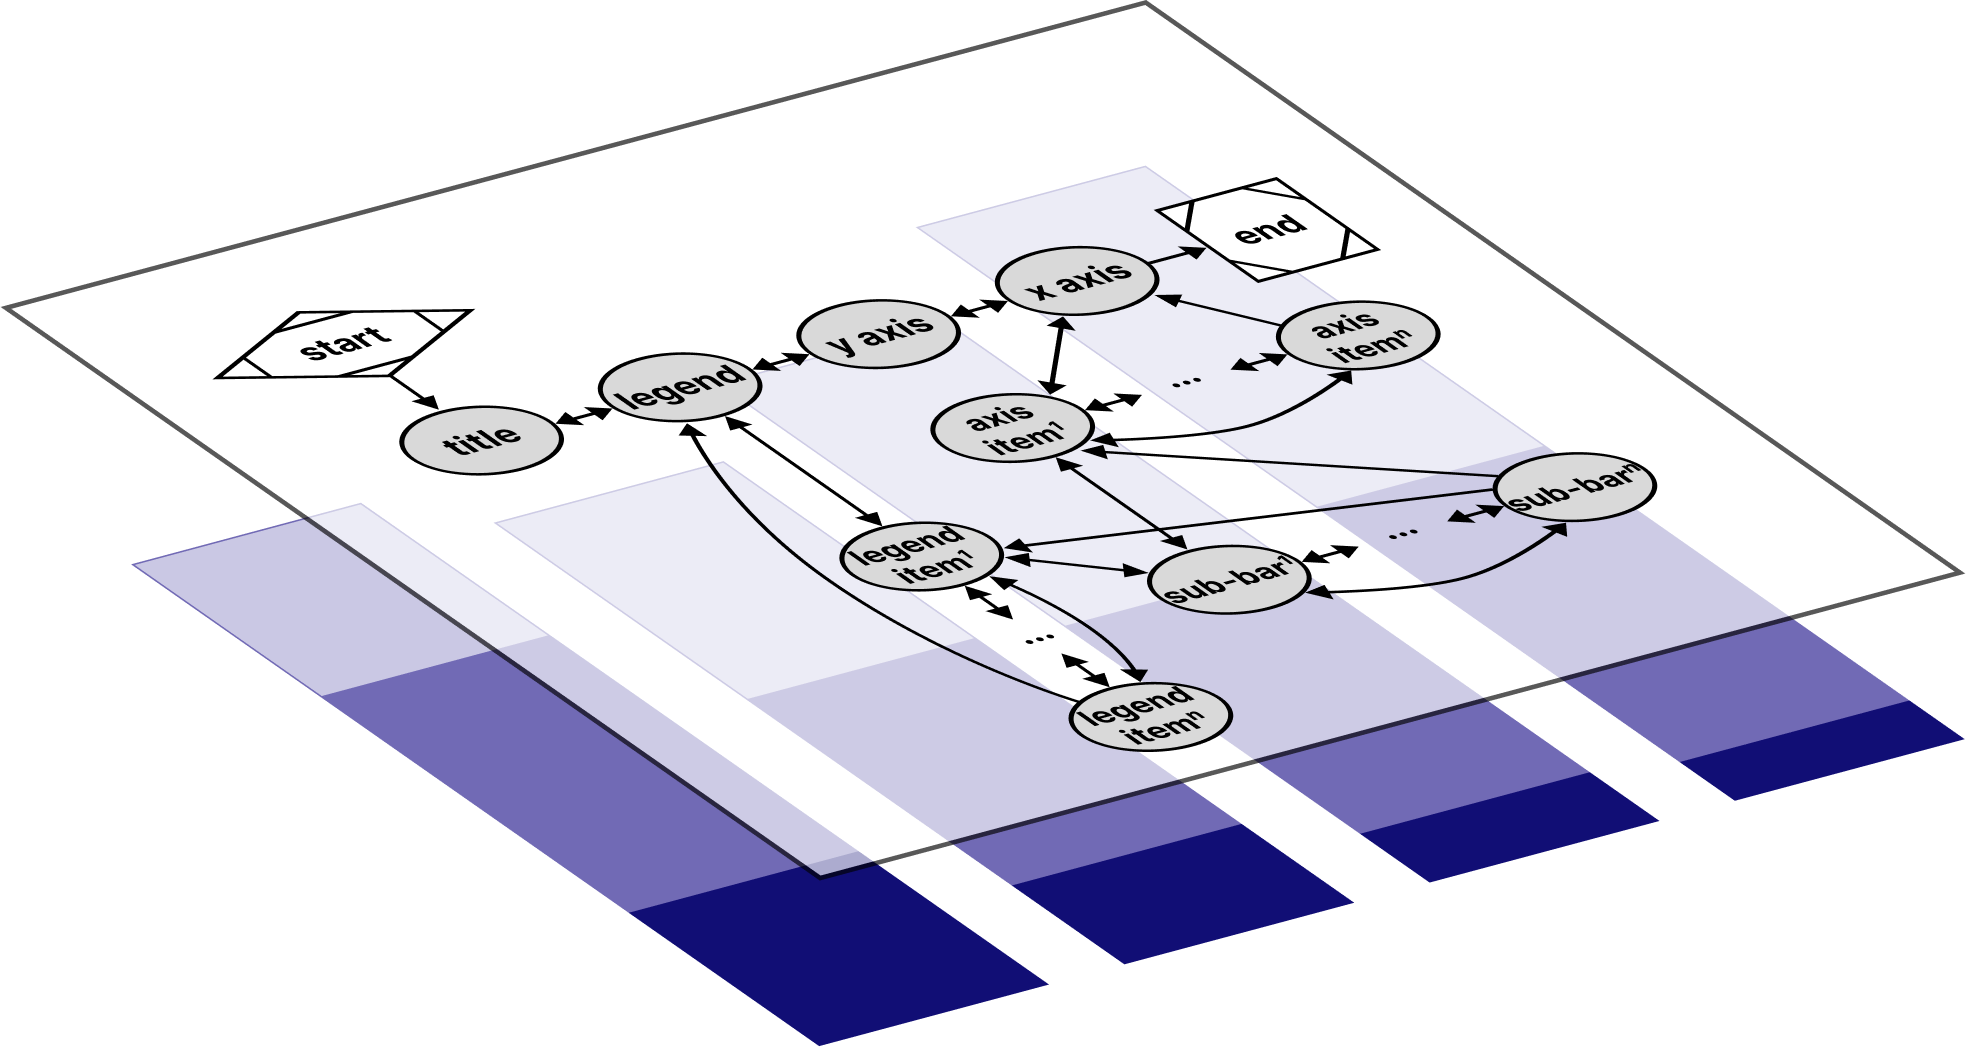
Data Navigator uses a graph-based infrastructure, comprised of nodes and edges. This allows us to do two really interesting things: create almost any other possible structure (list, hierarchy, spatial, network, etc) and prioritize direct relationships among data points. This underlying infrastructure is different from HTML's, which prioritizes hierarchies and not direct relationships.
It might seem like anarchy to design a low-level building block like this, but this is actually philosophically more empowering: designers and developers can add the structure and order that make the most sense for what they are doing, rather than try to make everything fit into a hierarchy.
Data Navigator allows designers and developers to express both rich and unique structures in ways that can handle making an entire library of charts more accessible or even take on unaddressed or bespoke visualizations.
And navigation of a structure can also be built to fit: Data Navigator abstracts navigation rules into namespaces, like "commands." Commands can be entirely customized to suit the needs of the structure they support. The advantage of this abstraction is that Data Navigator can be made to work with nearly any input modality as long as input is validated and converted into an existing command.
And lastly, Data Navigator can create an accessible rendering layer (using semantic HTML) on top of any existing visuals (or no visuals at all). This approach lets designers and developers fully control how navigation looks and feels for both screen readers and other input modalities without relying on whatever was used to render the original visualization (SVG, png, canvas, etc). This means that interactive elements in a visualization can be real "button" elements and not an SVG rectangle made from scratch to emulate a button.
@article{2023-elavsky-data-navigator,
  title = {{Data Navigator}: An Accessibility-Centered Data Navigation Toolkit},
  publisher = {{IEEE}},
  author = {Frank Elavsky and Lucas Nadolskis and Dominik Moritz},
  journal = {{IEEE} Transactions on Visualization and Computer Graphics},
  year = {2023},
  url = {http://dig.cmu.edu/data-navigator/}
}